


The gap between casual football bettors and consistently profitable ones often comes down to a single factor: how they use data. Recreational bettors watch matches, form opinions, and bet accordingly. Sharp bettors do all that but also interrogate the numbers beneath the surface, searching for insights that the eye test misses and that bookmakers might undervalue. In 2026, access to sophisticated football statistics has never been easier — the challenge is knowing which metrics matter and how to translate them into betting edge.
Football analytics has evolved dramatically over the past decade. What began with basic possession and shot counts has expanded into expected goals models, pressing intensity metrics, progressive passing data, and dozens of other measurements that capture aspects of performance invisible in traditional statistics. This wealth of information creates opportunity for bettors willing to invest time in understanding it, but also creates noise that can mislead those who grab numbers without context.
This guide walks through the essential statistics for football betting, explains what each metric actually measures, and demonstrates how to apply data analysis to different betting markets. By the end, you will have a framework for incorporating statistics into your research process and a clearer understanding of both the power and limitations of data-driven betting.
Expected Goals (xG) Analysis Data
What Is xG?
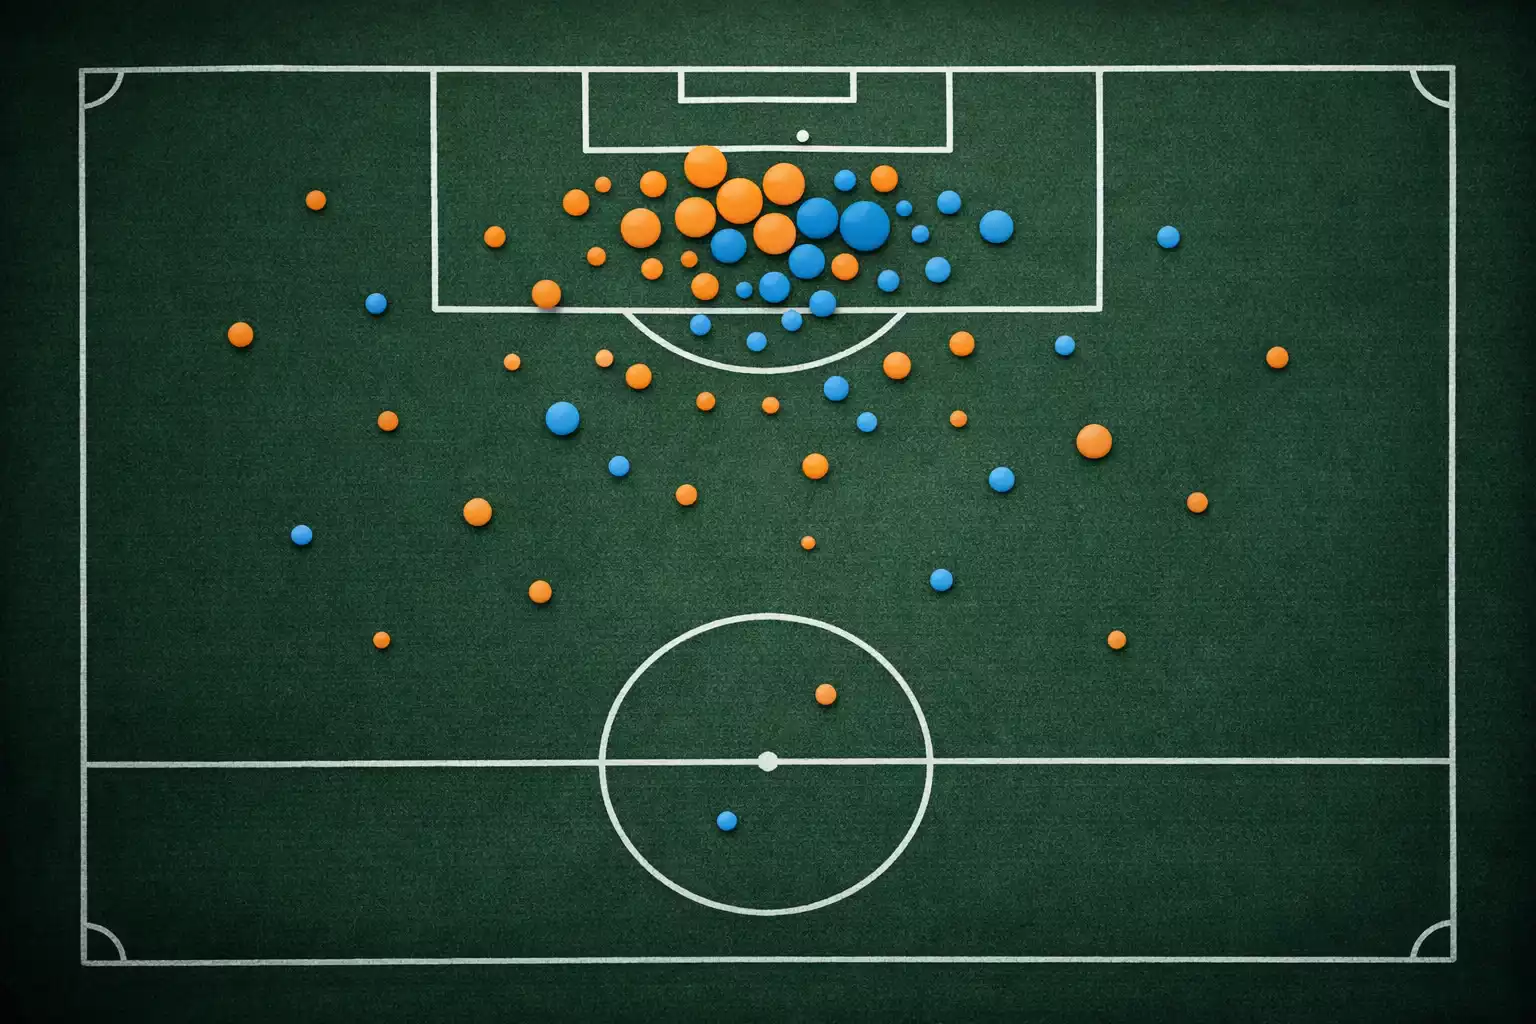
Expected goals, universally abbreviated as xG, has become the foundational metric of modern football analysis. The concept is straightforward: every shot in football can be assigned a probability of becoming a goal based on historical data from similar shots. A penalty kick might have an xG of 0.76, meaning penalties historically convert about 76% of the time. A header from eight yards out after a corner might carry 0.12 xG. A long-range effort from thirty yards might be worth just 0.03 xG.
Summing the xG values of all shots in a match produces team-level expected goals totals that represent how many goals each side “should” have scored given their shot quality. A team that creates three shots worth 0.40 xG each has accumulated 1.20 xG for the match, regardless of whether they actually scored zero, one, two, or three goals.
The power of xG lies in separating process from outcome. Football involves substantial randomness — shots hit posts, goalkeepers make exceptional saves, deflections redirect balls unpredictably. Goals scored fluctuate around true quality levels based on variance. Expected goals strips away that variance to reveal underlying chance creation quality, which proves more predictive of future performance than actual goals scored.
How xG Models Work
Different providers calculate xG using slightly different methodologies, but all models share common foundations. The primary inputs include shot location (distance and angle to goal), body part used (foot versus head), assist type (through ball, cross, cutback), game state (open play versus set piece), and whether the shot was a first-time strike or controlled touch.
More sophisticated models incorporate additional factors: defensive pressure on the shooter, goalkeeper positioning, the speed of the attack leading to the shot, and whether the chance came from a counter-attack or sustained possession. These additions improve accuracy but also introduce complexity and potential overfitting to historical patterns that might not persist.
No xG model is perfect, and small differences between providers can matter for betting purposes. A shot that one model rates at 0.35 xG might be 0.28 in another. Over single matches these differences are noise, but systematic biases across many matches can affect analysis. Understanding which model you use and its tendencies helps interpret the numbers more accurately.
Applying xG to Betting
The most direct betting application of xG is identifying teams over-performing or under-performing their expected goals. A team that has scored significantly more goals than their xG suggests is likely experiencing positive finishing variance that will regress. Backing unders or betting against them in upcoming matches exploits this expectation. Conversely, a team under-performing xG is probably due for better results.
For goals markets specifically, comparing team xG averages to their actual scoring rates reveals betting opportunities. If Team A averages 1.8 xG per home match but has only scored 1.2 actual goals, their underlying chance creation supports higher-scoring performances than recent results suggest. Over 2.5 goals becomes more attractive when you believe one side’s scoring will regress upward.
BTTS markets respond well to xG analysis because both teams’ expected goals matter. A matchup where both sides generate substantial xG (say, 1.5+ each) historically produces BTTS outcomes more frequently than actual goals might suggest if recent finishing has been poor.
Finding Reliable xG Data
Several platforms provide free xG data for major European leagues. FBref offers comprehensive xG statistics through their partnership with StatsBomb, covering the top five leagues plus several secondary competitions. Understat provides xG data with shot maps and additional context. Fotmob includes xG in their match reports and team statistics sections.
Paid services like StatsBomb directly, Opta, and others offer more granular data including per-shot xG values, expected goals chain metrics, and custom filtering options. For serious bettors, the investment in quality data sources often pays for itself through improved analysis.
Whichever source you use, consistency matters. Stick with one provider’s methodology rather than mixing numbers from different models, as the inconsistency introduces noise that makes comparison difficult.
Form and Performance Metrics

Analyzing Recent Form
Form analysis extends beyond simple win-loss records to capture performance quality regardless of results. A team winning three consecutive matches while being outplayed statistically presents differently than a team winning three while dominating their opponents. The first is riding variance that might correct; the second is genuinely performing at a high level.
The ideal form window balances recency against sample size. Five to eight matches typically captures current team quality without being distorted by single anomalous results. Weighting recent matches more heavily makes sense because teams evolve through a season — a performance from ten matches ago reveals less about current ability than last week’s performance.
Form metrics worth tracking include points per game over your chosen window, xG for and against, shot dominance ratios, and clean sheet or scoring percentages. These paint a fuller picture than standings position alone, which reflects entire season accumulation rather than current trajectory.
Home vs. Away Splits
Home advantage remains a measurable factor in football, though its magnitude has declined somewhat over recent years. Teams typically perform better at home across virtually every metric: more goals, more shots, more wins, fewer goals conceded. The 2026 landscape shows home advantage worth roughly 0.3-0.5 goals per match on average, though this varies significantly by league and individual team.
For betting purposes, analyzing home and away splits separately often reveals patterns that combined numbers obscure. A team with strong overall statistics might be genuinely dominant at home but merely average away, making them a poor selection for difficult away fixtures despite impressive season-long numbers.
Some teams show extreme home-away splits that create betting opportunities. Backing these teams at home offers value when bookmakers underweight their home dominance. Avoiding them away (or opposing them) makes sense when their road struggles are not fully reflected in odds.
Head-to-Head Records
Historical matchups between specific teams offer context that league-wide statistics miss. Some teams stylistically struggle against particular opponents regardless of relative quality. A mid-table side might consistently cause problems for a top-four team due to tactical matchups, manager dynamics, or psychological factors.
Head-to-head analysis requires appropriate filtering. Matches from five or more years ago featured different players, different managers, and different tactical approaches — their predictive value for today’s fixture is limited. Focus on recent meetings, ideally the last four to six matches between the sides, while noting any major changes in circumstances.
Specific head-to-head patterns matter for market selection. If meetings between two teams consistently produce under 2.5 goals regardless of their general scoring rates, that pattern suggests something about this particular matchup that general statistics miss. Similarly, if both teams always score when they meet, BTTS becomes attractive even if one side has recently been defensively solid.
Points Per Game and Goal Difference Trends
Points per game (PPG) provides a simple measure of team quality that accounts for varying numbers of matches played. A team with 25 points from 12 matches (2.08 PPG) is outperforming one with 27 points from 14 matches (1.93 PPG) despite having fewer total points.
PPG becomes especially useful for comparing teams at different stages of their schedules or across different leagues where match totals differ. It also enables quick mental calculations about expected standings trajectories — a team averaging 1.8 PPG projects to roughly 68 points over a 38-match season.
Goal difference trends reveal attacking and defensive trajectories. A team whose goal difference is improving over recent weeks is trending positively regardless of whether their points are also improving. This underlying momentum often predicts future results better than recent win-loss records alone.
Defensive Statistics
Clean Sheet Analysis
Clean sheet percentages measure how often teams prevent opponents from scoring. A team keeping clean sheets in 40% of matches has a meaningfully stronger defense than one managing clean sheets just 20% of the time. This simple metric directly applies to clean sheet betting markets and informs BTTS analysis.
Context matters for interpreting clean sheet rates. A team playing defensive football against superior opponents might keep unexpected clean sheets through parking the bus. Those same tactics against weaker opponents might produce the same scoreless defensive performances. Splitting clean sheet analysis by opponent quality clarifies true defensive ability.
Goalkeeper performance influences clean sheet rates in ways that can mislead. An exceptional goalkeeper might be bailing out a mediocre defense, producing clean sheets through individual brilliance rather than team defensive quality. When that goalkeeper is injured or rested, the team’s clean sheet probability drops significantly even if the same defensive lineup plays.
Goals Conceded Patterns
Beyond clean sheets, the distribution of goals conceded reveals defensive tendencies. A team that rarely concedes more than one goal even in defeats demonstrates defensive solidity that occasional lapses cannot obscure. A team that either keeps clean sheets or concedes three goals shows inconsistency that offers betting angles in both directions.
Timing of goals conceded matters for live betting and half-time markets. Some teams concede disproportionately in specific periods — early goals from slow starts, late goals from tired defending, or second-half collapses after halftime adjustments fail. These patterns, once identified, create market-specific opportunities.
Shot location data enriches goals conceded analysis. A team conceding many goals from crosses and headers has a specific vulnerability that certain opponents can exploit. A team conceding primarily from counter-attacks struggles against pace and transition play. Matching these defensive weaknesses to opponent strengths identifies fixtures where defensive problems become likely.
Expected Goals Against
Expected goals against (xGA) applies the same logic as offensive xG to defensive performance. Instead of measuring chance creation quality, xGA measures the quality of chances a team allows. A team with low xGA restricts opponents to poor shooting opportunities through defensive organization, pressing, and tactical discipline.
Comparing actual goals conceded to xGA reveals defensive over-performance or under-performance. A team conceding fewer goals than their xGA suggests is benefiting from strong goalkeeping or fortunate variance that might regress. A team conceding more than xGA is performing below their defensive process quality and should improve as variance evens out.
For betting, xGA helps identify whether recent clean sheets or defensive solidity reflects genuine quality or temporary luck. Backing a team to keep another clean sheet makes more sense when their xGA supports it than when they have been allowing high-quality chances but getting away with it.
Attacking Statistics
Scoring Patterns and Consistency
Attacking analysis begins with goals but extends into how and when teams score. Some teams score consistently across matches — one or two goals most games, rarely being shut out. Others show feast-or-famine patterns, scoring three or four goals one week and blanking the next. These different profiles suit different betting approaches.
Consistent scoring teams are BTTS banker candidates because they rarely fail to score. Their reliability in finding the net, even just once, makes BTTS Yes attractive when they face opponents who also typically score. Inconsistent teams are riskier for BTTS but might offer value in over/under markets when their explosive days arrive.
First-half versus second-half scoring splits reveal tactical tendencies. Teams that score early tend to set up matches for lower totals by protecting leads. Teams that score late often trail at halftime before pushing forward, creating different betting implications for period-specific markets.
Shot Volume and Quality
Raw shot numbers tell you how much a team attempts to score; shot quality metrics tell you how effectively they create genuine chances. A team averaging 18 shots per match sounds impressive until you learn that 14 of those are blocked or from outside the box. A team averaging 10 shots with half being clear chances from inside the penalty area is creating far more dangerously.
Shots on target percentage indicates finishing ability and chance quality together. Elite attacking teams typically put 35-45% of their shots on target. Below 30% suggests either poor finishing technique or poor chance creation that forces difficult shots. Above 45% usually indicates a team creating high-quality opportunities that are inherently easier to hit the target from.
Big chances created and converted represents another lens on attacking quality. Big chances — essentially one-on-one situations or open goals — should convert at roughly 45-55% rates. Teams significantly below this are missing sitters and due for improvement. Teams well above are overperforming and likely to regress.
Scoring First Statistics
The team that scores first wins approximately 65-70% of football matches across major leagues. This massive advantage makes “first team to score” markets and race-to-X-goals bets particularly interesting for teams that consistently score early.
Analyzing first goal statistics reveals which teams start fast and which tend to score from behind. A team that scores first in 60% of their matches possesses a significant edge that compounds through match dynamics — opponents must push forward, leaving space for counter-attacks and additional goals.
Conversely, some teams excel at coming from behind. While scoring first remains advantageous, teams that win high percentages of matches they trail show mental resilience and tactical flexibility that creates specific betting opportunities, particularly in live betting scenarios when they fall behind.
Set Piece and Special Statistics
Corner Statistics
Corners represent significant scoring opportunities that standard statistics often underweight. Teams average roughly 10-12 corners combined per match across top leagues, with considerable variation based on tactical approach and opponent quality. Analyzing corner generation and defensive corner concession reveals patterns useful for corners markets.
Attacking teams that dominate possession and pin opponents back generate more corners through sustained pressure. Defensive teams that absorb pressure and counter-attack generate fewer corners but concede more. These tendencies become predictable enough to exploit in total corners and team corner markets.
Corner conversion rates — how often corners lead to goals — vary substantially by team based on aerial prowess, set-piece coaching quality, and delivery accuracy. Teams with strong aerial presence and well-drilled routines convert corners at 3-4%, while others manage barely 1-2%. This gap creates value in correct score and exact goals markets when strong corner teams face opponents weak in aerial defense.
Cards and Fouls
Discipline statistics encompass yellow cards, red cards, and total fouls. These metrics respond to playing style, referee tendencies, and match context in ways that create betting opportunities in cards markets.
Some teams consistently accumulate cards through aggressive pressing, tactical fouling to prevent counters, or simply undisciplined play. Identifying these teams makes player card bets and total match card markets more predictable. Similarly, some teams draw many fouls through technical play and tricky attackers, creating card pressure on opponents.
Referee assignment dramatically affects card markets. Historical card averages by referee reveal massive variation — some officials average 3-4 yellows per match while others approach 6-7. Knowing the referee before betting on card markets provides genuine edge that many recreational bettors ignore.
Penalty Records
Penalties represent high-converting goal opportunities (roughly 76% conversion rate) that can swing goals markets. Teams that win many penalties — typically through fast, skillful attackers who draw fouls in the box — effectively boost their expected goals totals in ways that general xG sometimes misses.
Penalty-taking records for specific players matter for goalscorer markets. A reliable penalty taker on a team that wins frequent penalties has an artificial boost to their scoring probability that bookmakers may not fully price into anytime goalscorer odds.
Penalty concession rates matter for BTTS and clean sheet markets. A team that frequently concedes penalties has a hidden defensive vulnerability that goes beyond shot-based xGA. Even strong defensive teams can see clean sheets ruined by spot-kick concessions.
League-Specific Patterns
Understanding League Characteristics
Different leagues produce systematically different statistical profiles that affect betting market pricing. The Bundesliga historically averages more goals per match than Serie A. The Premier League features more physical play and aerial challenges than La Liga. Ligue 1 shows stronger home advantage than the Dutch Eredivisie.
These league-level patterns should inform your expectations when analyzing teams. A team averaging 2.5 xG per match in the Bundesliga operates in a higher-scoring environment than one averaging 2.5 xG in Serie A — the raw number means different things in different contexts.
Bettors who specialize in specific leagues gain edge by deeply understanding these contextual factors. Generalists who bet across many leagues without adjusting for structural differences often missprice situations that specialists recognize immediately.
Home Advantage Variations
Home advantage magnitude varies substantially across leagues and even within leagues across different seasons. The pandemic era saw home advantage nearly disappear in some leagues when matches were played behind closed doors, then partially recover as crowds returned.
In 2026, home advantage remains meaningful but weaker than historical norms in most top European leagues. The English Championship shows stronger home advantage than the Premier League. German lower divisions show stronger home advantage than the Bundesliga. Understanding these gradients helps price home wins more accurately.
Some specific stadiums produce extreme home advantages through intimidating atmospheres, challenging playing surfaces, or difficult travel logistics for visitors. Identifying these outlier venues creates betting opportunities when bookmakers apply league-average home advantage assumptions to above-average home venues.
Seasonal Trends
Football seasons follow predictable patterns that statistical analysis should account for. Early-season matches feature more variance as teams find their rhythm and new signings integrate. Late-season matches feature varying motivation levels based on standings position and competitive stakes.
Goal totals typically rise slightly in spring as pitches improve and teams prioritize attack over defensive security in dead rubbers. Matches between teams with nothing to play for often produce entertaining, open contests that statistical models based on season-long averages might underrate for goals.
Fixture congestion from cup competitions and European matches affects team performance in measurable ways. Teams playing multiple matches per week show decreased physical intensity, more rotation, and often worse results than their underlying quality suggests. Building fixture congestion adjustments into your analysis captures edges that bookmakers may not fully price.
Building Your Analysis Framework

Creating a Research System
Systematic research outperforms ad-hoc browsing through statistics. Develop a consistent process that you apply to every match you consider betting, covering the same metrics in the same order regardless of the specific fixture.
Start with team-level statistics: xG for and against, recent form, home/away splits, and clean sheet rates. Then examine head-to-head records for this specific matchup. Next, check team news for injuries, suspensions, and potential rotation. Finally, consult odds across multiple bookmakers to identify where your statistical edge might translate into betting value.
Document your analysis rather than keeping it in your head. A simple spreadsheet recording your statistical findings for each match creates a reference for tracking accuracy over time and identifying systematic biases in your analysis.
Key Data Sources
Building a data workflow requires identifying reliable sources for each statistic you track. For xG and advanced metrics, FBref and Understat provide free comprehensive data for major leagues. For basic statistics and results, most sports data sites including ESPN, Flashscore, and Soccerway offer what you need.
For injury news, team official channels combined with league-specific journalists provide the most reliable pre-match information. For odds comparison, dedicated comparison sites aggregate bookmaker prices across dozens of operators.
Consolidate your sources into a streamlined workflow. Having five tabs open with your standard sources ready to go when you begin match research saves time and ensures consistent coverage. Over time, you will develop preferences for specific sites based on data presentation, update speed, and reliability.
Working with Spreadsheets
Spreadsheets transform raw data into actionable betting insights. At minimum, track your betting history with columns for date, match, selection, odds, stake, and result. Calculate cumulative profit/loss, ROI, and performance by market type.
More advanced spreadsheet work includes building simple models that calculate implied probability from team statistics. Even basic models that average xG figures and apply home advantage adjustments can identify mismatched odds worth investigating further.
Automation through spreadsheet formulas and data import functions saves time as your analytical ambitions grow. Importing match data directly from statistical sites rather than typing numbers manually reduces errors and speeds up pre-match research.
Applying Statistics to Betting Decisions

Translating Data to Predictions
Statistical analysis produces probabilities, not certainties. The goal is translating your data findings into probability estimates that you compare against bookmaker odds. If your analysis suggests Team A wins 55% of matches like this one but odds imply only 45%, you have identified potential value.
Be explicit about your probability estimates rather than working with vague notions of which side is better. Write down “I estimate this team wins this match 58% of the time” and compare that specific number to implied odds probabilities. This precision forces intellectual honesty about your actual beliefs.
Combine multiple statistical signals rather than relying on single metrics. A team showing positive xG trends, strong home form, favorable head-to-head records, and healthy squad depth presents a convergent case that single-metric analysis might miss. Conversely, conflicting signals — strong xG but poor recent results — demand explanation before betting.
Identifying Value Through Statistics
Value exists when your statistically-derived probability exceeds implied probability from bookmaker odds. The larger that gap, the more confident your bet. Minimum edges of 5-10% provide margin for estimation error; smaller apparent edges might disappear when you account for uncertainty in your analysis.
Track which statistical approaches produce profitable betting outcomes and which lead you astray. If your xG-based analysis shows positive returns but your form-based analysis loses money, weight the profitable approach more heavily going forward.
Acknowledging Limitations
Statistics describe tendencies, not deterministic outcomes. A team with 2.0 xG per match will not score exactly two goals every game — variance remains substantial over small samples regardless of analytical sophistication.
Statistics also cannot capture everything relevant to outcomes. Player psychology, motivation levels, and in-game tactical adjustments all influence results in ways numbers struggle to quantify. The best analysts complement data work with match watching and contextual understanding. The goal is better decisions on average, not perfect predictions.
Moving Forward with Data-Driven Betting

Statistical analysis transforms football betting from pure speculation into a structured endeavor where knowledge compounds over time. The metrics covered in this guide — expected goals, form analysis, defensive and attacking statistics, set piece data, and league-specific patterns — provide a foundation for understanding matches at a deeper level than casual observation allows.
The challenge is maintaining discipline in applying these tools consistently. Building analysis habits, tracking results, and iterating on your approach based on what actually produces profits requires ongoing commitment. Many bettors learn statistical concepts but fail to implement them systematically, negating their potential edge.
Start with the fundamentals: xG and basic form metrics for leagues you know well. As comfort grows, incorporate additional data points and expand to new markets. The goal is not to analyze everything but to analyze what matters for your betting approach more thoroughly than bookmakers assume typical bettors will. That gap between your preparation and their expectations is where value lives.
